
Global Agricultural News, Issue 108
Issue 10810月3日–9日
01 US farm debt hits record high, official data may undercount it
On October 8, 2026, Reuters published an analysis titled "US farm debt is at a record. Official data might be undercounting it," focusing on how the growth of US farm debt and the expansion of non-traditional financing affect debt statistics and risk assessment. The article argues that US farm debt is expected to hit a record high, while the increasing use of non-traditional financing in agriculture makes the assessment of debt scale and related risks more complex.
US farm debt continues to grow, and the expansion of non-traditional financing adds to the difficulty of accurately counting actual liabilities. The USDA Economic Research Service projects that in 2026 US farm debt will reach $605.1 billion (about RMB 4.07 trillion), up 4.6% in nominal terms and 1.5% in real terms (after inflation) from 2025; over the same period, the farm debt-to-asset ratio is expected to rise from 13.34% to 13.54%. In the long run, inflation-adjusted farm debt has more than doubled from about $300 billion (about RMB 2.02 trillion) in 2000. Meanwhile, some financing that farms obtain through input suppliers, equipment dealers and similar channels may not be fully captured by existing statistics. This may not only mask the real financial stress of some farms but also make it harder for lenders to fully judge borrowers' repayment risks. If farm operations deteriorate, the suppliers and retailers extending credit may face additional losses and further ripple effects across the agricultural business system.
The article notes that a Kansas State University agricultural finance professor estimates that the "individuals and others" debt category reported by USDA for 2025 — about $45 billion (about RMB 303 billion) — could in reality be 2 to 3 times the official figure. Reuters interviews with more than 52 large-scale row-crop growers across seven states in the US Midwest and South show that most respondents held 7 to 10 separate lines of credit, with some exceeding 30. Because some equipment dealers require farmers to open a separate line of credit for each new equipment purchase or lease, a single farm can carry multiple scattered financing arrangements, further complicating debt statistics and accounting. In addition, a 2024 study found that between 2001 and 2019, farm equipment debt extended by non-traditional lenders in 14 agricultural states could be as much as four times the official figure. That conclusion applies only to farm equipment debt from non-traditional lenders in specific regions and does not mean the overall US farm debt is undercounted by the same proportion. In response to the statistical gap, USDA is cross-checking farm surveys against Farm Service Agency loan records and studying the size of the non-traditional financing market to better understand the debt situation, hoping to produce results within two years.
US farm debt keeps rising, and the growth of non-traditional financing makes the true liability picture harder to grasp. USDA is improving its statistics and research to assess farm financial stress and its potential spillover. If farm repayment capacity deteriorates, the suppliers and other agribusinesses extending credit could also face credit risk, and the pressure may further transmit through the agricultural business system.
Source: Reuters
Compiled by: Office
02 US non-GMO soybean acreage ends five-year decline
On October 5, 2026, the US Soybean Export Council (USSEC) released the "Non-GMO Soybeans Acreage Study Final Report 2026." The report shows that in 2026 US non-GMO soybean acreage rebounded sharply, ending five consecutive years of decline, with both food-grade and feed-grade categories expanding.
US soybean production is dominated by genetically modified (GM) varieties, while non-GMO soybeans primarily serve niche markets such as food processing and specialty feed, with a relatively limited planting scale. According to USSEC's annual planting survey, US non-GMO soybean acreage fell for five straight years from 2020 to 2025, from about 5.0 million acres to about 3.3 million acres. The main reason was that as ordinary soybean prices rose, the relative return advantage of non-GMO soybeans weakened. USSEC data show that in 2021 ordinary soybean purchase prices rose about 48% year-on-year, while the dedicated premium for food-grade non-GMO soybeans rose only 4%; in 2022 the respective price increases were 18% and 13%. A 2024 grower survey also found that non-GMO soybeans cost about $9 more per acre to produce than GM soybeans, and yields on some fields were 2 to 5 bushels per acre lower. With premium growth relatively limited and cost and yield gaps, farmers' planting incentives weakened. Against this industry backdrop, the report combines grower and purchaser surveys with USDA public data to analyze the planting structure, market supply and demand, and export trade of US non-GMO soybeans.
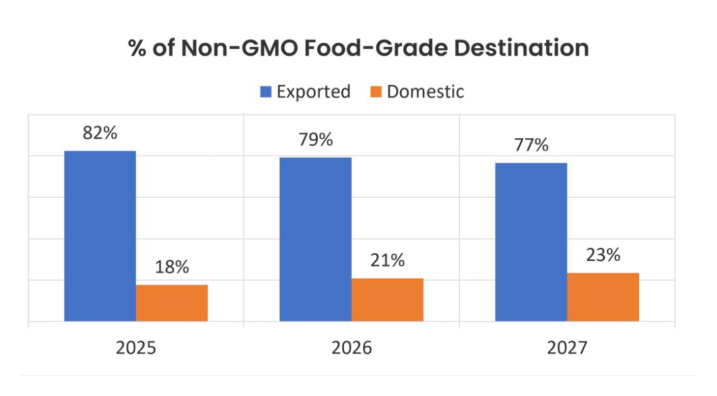
The report shows that in 2026 US non-GMO soybean acreage was about 4.3 million acres, up 31% year-on-year. Of this, food-grade non-GMO soybean acreage was about 2.0 million acres, up 40%; feed-grade non-GMO soybean acreage was about 2.3 million acres, up 35%. In step with the recovery in planting scale, the farm-gate premium for food-grade non-GMO soybeans also rose: market monitoring data show that in 2026 the premium for this category rose from $2.57 per bushel (about RMB 17.3) in 2025 to $2.72 (about RMB 18.3). In terms of trade flow, US food-grade non-GMO soybeans have a high export share, with about 79% of output supplied to the international market; Japan is the largest export market, accounting for 55% of related export volume, with South Korea, Taiwan region of China, Thailand and the EU also major markets. By downstream processing use, food-grade non-GMO soybeans are mainly used in traditional soyfood production, with tofu, soy milk and natto accounting for 34%, 19% and 14% of total consumption of this category, respectively.
This rebound in planted area provides a new basis for observing the subsequent development of the US non-GMO soybean industry. Going forward, the industry's development will still need to balance planting returns with overseas market demand; whether production scale can be maintained depends on the match between market demand and planting returns.
Source: US Soybean Export Council
Compiled by: Office
03 WRI: EU import-linked deforestation concentrated in few countries and products
On October 6, 2026, the World Resources Institute (WRI) published an analysis titled "How the EU Deforestation Policy Could Reduce Forest Loss Around the World." The article points out that deforestation caused by the cultivation of the six EU-imported product categories — beef, palm oil, soybeans, cocoa, coffee and rubber — accounts for 85% of the total. By producing country, nearly 74% of the deforestation linked to EU imports of these six products plus timber occurs in just six countries: Côte d'Ivoire, Brazil, Indonesia, Malaysia, Ghana and Peru.
To reduce deforestation caused by imported product production, the EU adopted the EU Deforestation Regulation (EUDR) in 2023, requiring relevant commodities to provide origin information and prove they meet deforestation-free requirements when entering the EU market. The regulation will apply to large and medium operators from December 30, 2026. Because the EU imports a wide variety of agricultural and forestry products from many producing countries, it is difficult to determine which specific products and countries cause the most deforestation. To understand where the deforestation risks from EU imports are concentrated and where EUDR implementation could have the greatest effect, WRI selected the seven product categories regulated by EUDR and, combining data on agricultural and forestry trade, land use and forest cover change, analyzed the main sources of EU-import-linked deforestation.
Specifically: (1) Cocoa cultivation in Côte d'Ivoire and Ghana causes substantial forest loss. The two countries rank first and fifth, respectively, in EU-import-linked deforestation. Of these, the forest area Côte d'Ivoire lost solely to produce cocoa for the EU accounts for about 40% of the total forest loss linked to EU imports. In addition, cocoa cultivation in both countries has caused some damage to protected-area forests — about 37% of Côte d'Ivoire's forest loss from cocoa occurs in protected areas, and over 13% for Ghana. (2) Brazil's forest loss mainly stems from soybean and beef production. Brazil ranks second. In 2021–2023, the deforestation annually associated with EU imports of Brazilian soybeans and beef averaged about 13,600 hectares and 10,400 hectares, respectively, totaling about 24,000 hectares. (3) Indonesia and Malaysia's forest loss mainly comes from palm oil. The two countries rank third and fourth, with most forest loss related to palm oil production. In 2021–2023, Indonesia's deforestation linked to EU imports averaged about 8,000 hectares per year, of which palm-oil-related deforestation accounted for about 90%; Malaysia's averaged about 4,000 hectares per year, also closely tied to palm oil. (4) Peru's forest loss involves multiple crops. Peru ranks sixth; in 2021–2023, Peru's exports to the EU caused average annual forest loss of about 3,900 hectares, more than half of which relates to cocoa, coffee and palm oil production.
Overall, EU-import-linked deforestation is concentrated in a few countries and specific products, with beef, soybeans and palm oil particularly prominent. As EUDR is implemented, origin traceability and supply-chain scrutiny for related products will be further strengthened, and agricultural exporters in the main deforestation-source countries will face stricter compliance requirements.
Source: World Resources Institute
Compiled by: Liu Xingyu (Group A)
04 USDA releases China Sugar Semi-Annual report
On October 5, 2026, the USDA Foreign Agricultural Service (FAS) released the "Sugar Semi-Annual" report for China. The report projects that in 2026/27 China's sugar production will continue to grow, consumption will rise modestly, imports will fall, and the domestic production-consumption gap is expected to narrow further.
In recent years, China's sugar output has recovered, but domestic consumption still exceeds production. Data show that China's sugar production rose from 11.16 million tonnes in 2024/25 to an estimated 12.95 million tonnes in 2025/26, while consumption rose from 15.39 million tonnes to an estimated 15.70 million tonnes over the same period; the production-consumption gap has narrowed, but domestic output still cannot fully meet demand and must be supplemented by imports. The US is a major global sugar producer and importer, and international sugar supply-demand changes are closely tied to its domestic supply and trade situation. To track international sugar market dynamics, USDA FAS continuously monitors supply, demand and trade in major sugar-producing and consuming countries such as China and regularly publishes related reports. This "China Sugar Semi-Annual" updates China's sugar production, consumption and import forecasts, providing a reference for judging international sugar supply-demand and trade changes.
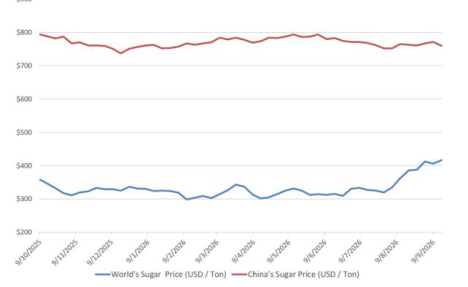
The report highlights four changes: (1) Growing domestic supply. Total sugar production in 2026/27 is forecast at 13.37 million tonnes, up 420,000 tonnes from the 2025/26 estimate. Of this, cane sugar output is expected to rise 620,000 tonnes to 12.00 million tonnes, driven by expanded sugarcane acreage in Guangxi and increased imported sugarcane in Yunnan; beet sugar output is expected to fall 200,000 tonnes to 1.37 million tonnes as declining returns from beet planting in Inner Mongolia and Xinjiang reduce beet acreage. The cane sugar gain more than offsets the beet sugar loss, so total output still grows. (2) Limited consumption growth. 2026/27 sugar consumption is forecast at 15.80 million tonnes, up 100,000 tonnes from the prior estimate. The report notes overall weak downstream demand — for example, in the first eight months of 2026 China's beverage output fell 0.6% year-on-year cumulatively; although August alone rose 0.6% year-on-year, cumulative output remained below the prior year. (3) Lower import forecast. Imports in 2026/27 are expected to fall to 3.80 million tonnes, down 775,000 tonnes from the prior estimate. The report believes high international sugar prices and rising domestic output will curb imports; industry sources expect that out-of-quota import licenses could tighten, though no clear new measures have been confirmed in effect. (4) Rising ending stocks. According to the report's balance sheet, 2026/27 ending stocks are expected to rise from an estimated 3.369 million tonnes to 4.579 million tonnes, an increase of 1.21 million tonnes. Despite lower imports, increased domestic output will push total production plus imports above consumption plus exports, driving stocks up.
Higher production, lower imports and rising stocks will jointly affect China's new crushing-season sugar market. Increased domestic supply should reduce import demand, but international prices, import policy and consumption changes will still shape actual import volumes.
Source: USDA Foreign Agricultural Service
Compiled by: Tu Biguo (Group A)
05 US commits $825 million to expand international food aid
On October 8, 2026, the USDA announced an investment of $825 million (about RMB 5.555 billion) to implement the "America First" international food assistance program. The move aims to expand aid to food-short regions while increasing purchases of US-grown agricultural products.
The US has long conducted international food assistance by procuring domestic agricultural products, relieving food shortages in recipient regions while supporting domestic farm production and sales and expanding external economic and trade cooperation. In April 2024, USDA and USAID announced the use of $1 billion in Commodity Credit Corporation (CCC) funds to purchase US agricultural products for overseas emergency food relief. In January 2025, the Trump administration, arguing that some foreign aid did not sufficiently align with US national interests, announced a 90-day pause on new foreign development assistance funding commitments and disbursements to review program effectiveness and consistency with US foreign policy, deciding whether to retain, adjust or terminate related programs. During the review, humanitarian programs such as emergency food aid received temporary exemptions allowing them to continue. Other paused assistance programs were partly restored after review. Since then, while continuing international food assistance, the US has further strengthened the "America First" orientation, placing greater emphasis on procuring domestic agricultural products and using US transportation services to support domestic agriculture and shipping and expand long-term trade cooperation with recipient countries.
The assistance is arranged as follows: (1) Expanding emergency food aid. Under Food for Peace, about 129,000 tonnes of US agricultural products will be procured to provide emergency food relief to Ethiopia, Kenya, the Democratic Republic of Congo and Haiti. USDA has reached principle agreements on eight projects involving $357 million in new funding. (2) Supporting school feeding programs. Under the McGovern-Dole International Food for Education and Child Nutrition Program, about 62,200 tonnes of US agricultural products will be procured to implement seven five-year projects in Bolivia, Cambodia, Ecuador, Guinea, Honduras, Liberia and Timor-Leste. The projects plan to cover 6,415 schools, improving students' nutrition, literacy and attendance through meals. USDA expects the projects to reach about 1.2 million children and their families with US agricultural products. (3) Promoting agricultural development. Under Food for Progress, about 311,700 tonnes of US agricultural products will be procured to modernize agricultural value chains in Bangladesh, Bolivia, Ecuador, Morocco, Sri Lanka, Thailand and the Philippines, improving production, processing and distribution systems and supporting long-term trade partnerships.
USDA states that by prioritizing US agricultural products and using US transportation services, international assistance can meet recipient food needs while creating economic opportunities for US producers and helping recipient countries improve self-sufficiency. The programs' effectiveness still depends on follow-through on agreements, procurement and shipping progress, and actual implementation on the ground.
Source: USDA Foreign Agricultural Service (FAS)
Compiled by: Office
06 CJ CheilJedang and ADM to form feed-grade amino acid joint venture
On October 2, 2026, according to ADM's website, South Korea's CJ CheilJedang and ADM plan to form a feed-grade amino acid joint venture in the United States. Under the equity arrangement, CJ's CJ BIO America would hold 63% of the joint venture and ADM 37%. The new company would integrate three existing production facilities and related sales networks in the US and Brazil to improve the competitiveness and supply stability of feed-grade amino acid production in the Americas market.
Lysine is an important feed-grade amino acid, widely used in livestock and poultry feed such as swine and poultry to supplement nutrients needed for animal growth. The US is one of the major lysine consumption markets but is highly dependent on imports. Market research firm IndexBox data show that in 2024 US imports of lysine and its esters and salts were about 80,000 tonnes, up 36% year-on-year, accounting for about 37% of domestic consumption that year. As import volumes grow, domestic production capacity and supply-chain stability have drawn policy attention. In June 2025, the US House Appropriations Committee, in its report on the FY2026 Agriculture, Rural Development, FDA and Related Agencies Appropriations Act, listed amino acids as critical agricultural inputs, proposing to assess dependence on import supply and study measures to lower barriers to domestic production and mitigate supply-chain disruption risks.
To sustain domestic production, US firms need to improve cost competitiveness through better production technology, stronger raw-material supply security and integrated sales channels. ADM is a large US agricultural processing and nutrition company with grain supply, processing and fermentation capacity; in 2025 its animal nutrition business generated $3.325 billion (about RMB 22.520 billion) in revenue. CJ is a South Korean food and biotech company whose bio business uses fermentation technology to produce and sell feed-grade amino acids; its CJ BIO operates 13 manufacturing facilities worldwide with fermentation capacity exceeding 700,000 tonnes and the ability to ferment eight major feed-use amino acids. The two sides have complementary advantages in amino-acid raw-material supply, facility production, technology and sales networks; this cooperation integrates their resources to improve the cost competitiveness and long-term supply capacity of US domestic production.
Under the announced plan, the new joint venture will mainly pursue three areas of business: (1) Producing feed-grade amino acids. The new company will take over CJ's fermentation production facilities in Fort Dodge, Iowa (US) and Piracicaba, Brazil, as well as ADM's feed-grade amino acid production facility in Decatur, Illinois (US), integrating existing production resources to produce feed-grade amino acids. (2) Product development and technical application. The new company will license relevant CJ intellectual property and use its fermentation technology to develop and produce feed-grade amino acid products in North and South America. (3) Sales in the Americas market. The new company will integrate CJ's sales offices in the US, Mexico and Brazil and gain exclusive rights granted by both parties to produce and sell feed-grade amino acids in the Americas, unifying regional sales.
This cooperation is expected to leverage CJ's strength in amino-acid fermentation technology and ADM's advantages in raw-material supply and US domestic production, improving the utilization efficiency of existing production resources and long-term supply stability in the Americas market. Currently, the joint venture still needs to complete relevant closing procedures and obtain regulatory approval.
Source: ADM
Compiled by: Zhang Shuangqin (Group A)
| Name | Unit | Major | Degree | Grade |
|---|---|---|---|---|
| Zhang Shuangqin | Nanjing Agricultural University | International Business | Master students | 2026 level |
| Liu Haonan | Nanjing Agricultural University | International Business | Master students | 2026 level |
| Pan Zihan | Nanjing Agricultural University | International Business | Master students | 2026 level |
| Liu Xingyu | Nanjing Agricultural University | International Trade | Master students | 2026 level |
| Sun Weikang | Nanjing Agricultural University | International Trade | Master students | 2026 level |
| Tu Biguo | Nanjing Agricultural University | International Trade | Master students | 2026 level |
Compiled by: Nanjing Agricultural University "Great Nation Strengthens Agriculture" Globalization and Agricultural and Rural Development Research Team
Sponsored by: China Society for Foreign Agricultural Economics (CSFAE)
Editors: Xie Chaoping, Tian Xi
Team leaders: Luo Yaping and Zhang Shuangqin
Special thanks: Foreign Investment Promotion Division, Department of International Cooperation, Ministry of Agriculture and Rural Affairs
Center for Sustainable Standards, Central University of Finance and Economics
Contents6 items · Open a title in the PDF
- U.S. farm debt hits a record high.P3
- The acreage of non-GMO soybean cultivation in the United States has ended its five-year decline.P4
- WRI’s analysis indicates that deforestation linked to EU imports is concentrated in a small number of countries and product categories.P5
- The U.S. Department of Agriculture releases the “China Sugar Semi-Annual Report.”P7
- The United States is investing $825 million to expand international food aid.P8
- CJ CheilJedang of South Korea and ADM plan to establish a joint venture for feed-grade amino acids.P10